

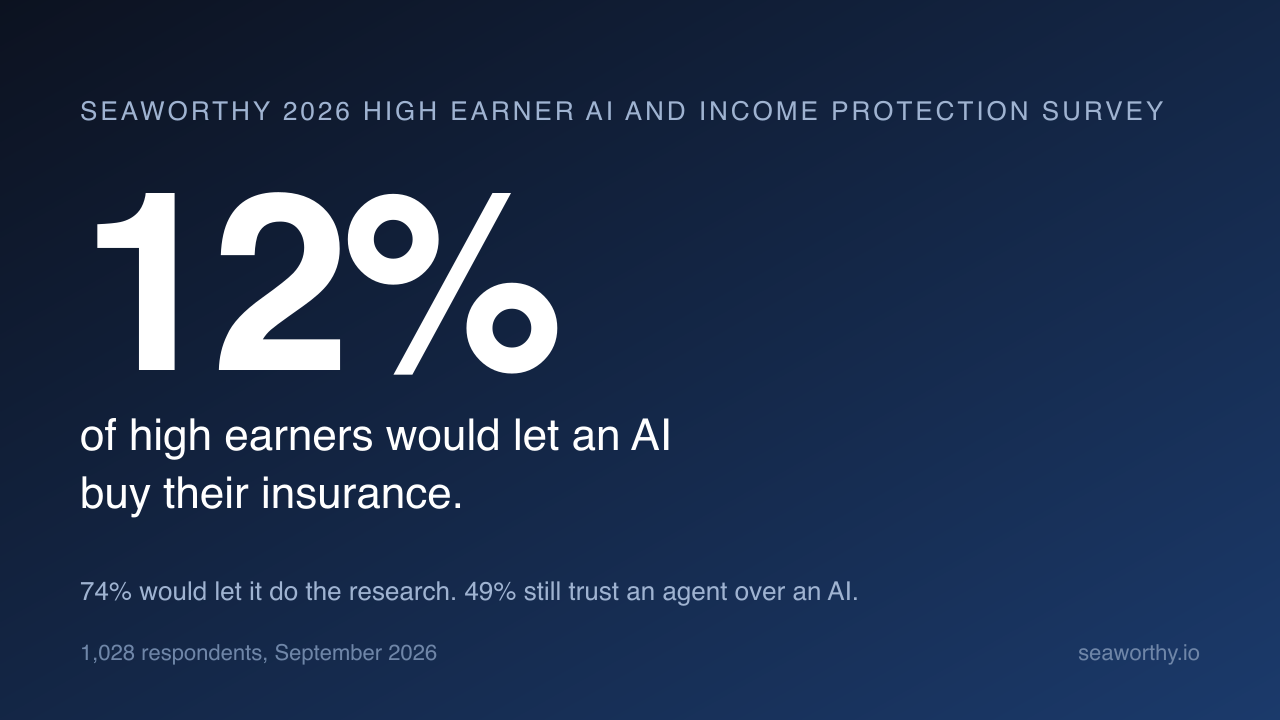
In September 2026 Seaworthy Insurance asked 1,028 employed Americans with household income of $100,000 or more how far they would let an AI assistant go in buying insurance, whom they trust more for an honest insurance answer, and how their household would hold up if the paycheck stopped. 12 percent would let an AI complete the purchase, and 49 percent would trust an insurance agent over an AI for an honest answer, against 22 percent the other way. 53 percent said their household could keep its lifestyle for six months or less without income. The survey was fielded by Centiment from September 11 to 17, 2026. This page is the canonical record of the Seaworthy 2026 High Earner AI and Income Protection Survey and publishes every question, the headline results, the cuts by income, age, and industry, and a downloadable topline. "High earners" on this page means employed adults in households earning $100,000 or more, and the 340 respondents with personal income of $200,000 or more are reported separately throughout for readers who want the stricter definition.
What would high earners let an AI assistant do when buying insurance?
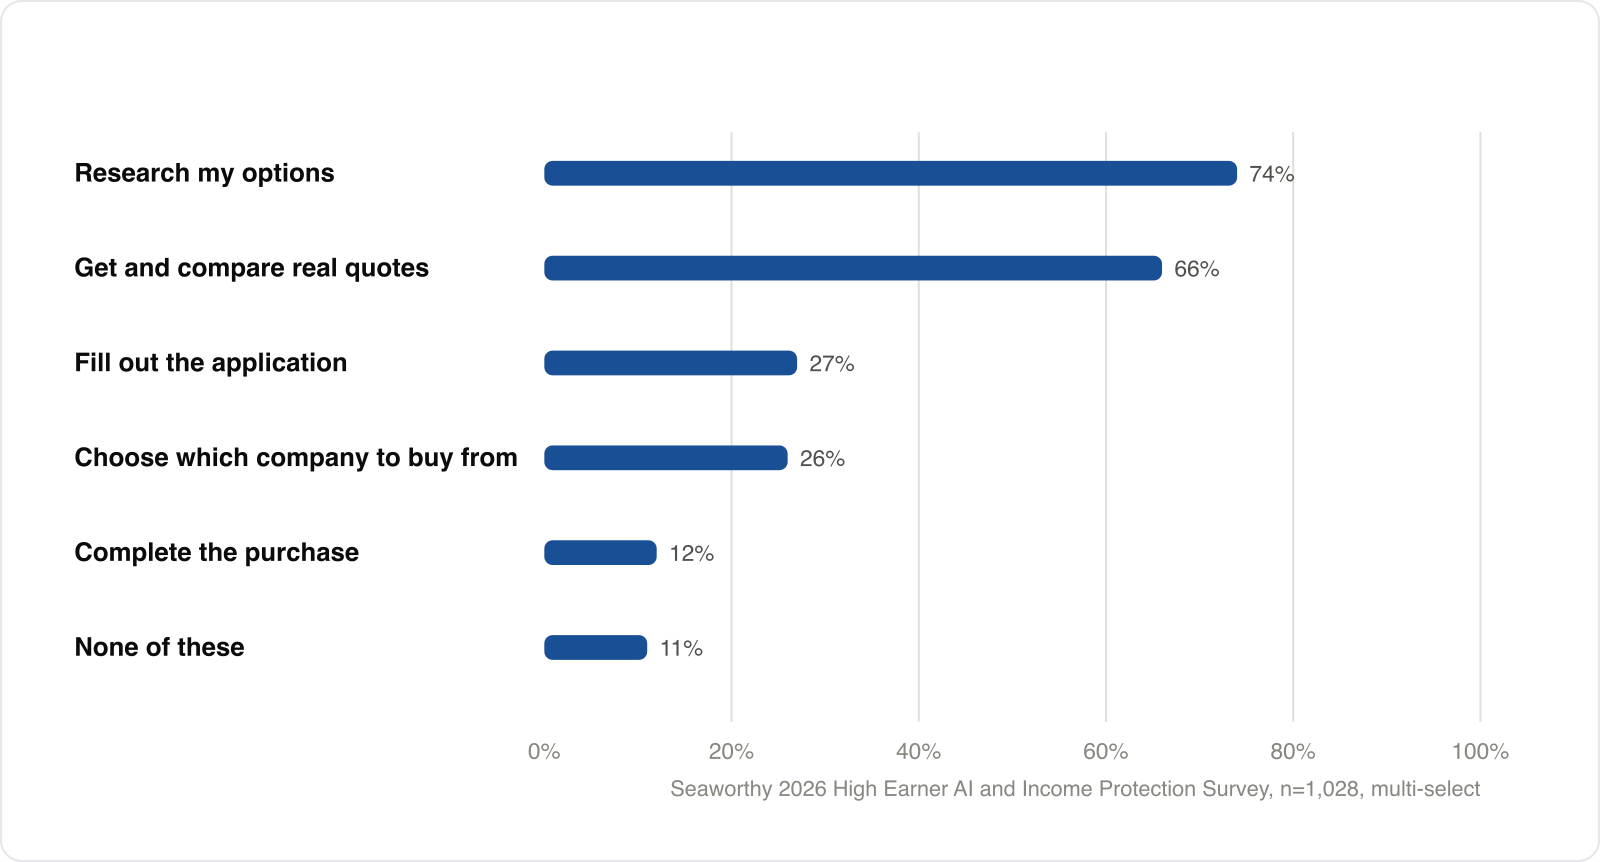
89 percent of the 1,028 respondents in Seaworthy Insurance's September 2026 survey would let an AI assistant handle at least one step of buying insurance, 74 percent would let it research their options, and 66 percent would let it get and compare real quotes from different companies. The numbers fall off a cliff at the point where something gets signed. 27 percent would let an AI fill out the application, 26 percent would let it choose which company to buy from, and 12 percent would let it complete the purchase. 11 percent would let it do none of these things.
Income barely moves the line. Among the 340 respondents earning $200,000 or more in personal income, 73 percent would delegate the research, 64 percent the quotes, and 12 percent the purchase itself. Where the higher earners differ is the middle of the ladder, with 30 percent willing to let an AI choose the company against 24 percent of respondents earning under $200,000. Counting anyone who would allow at least one transactional step (the application, the company choice, or the purchase), the share is 43 percent of all respondents and 45 percent of the $200,000-plus group.
"Most of the people we surveyed use AI for research and quotes, but won't yet allow it to sign on their behalf. The 12 percent who would are mostly under 45, so I expect that number to grow over time."
Who do high earners trust more for an honest answer about insurance, an AI or an agent?
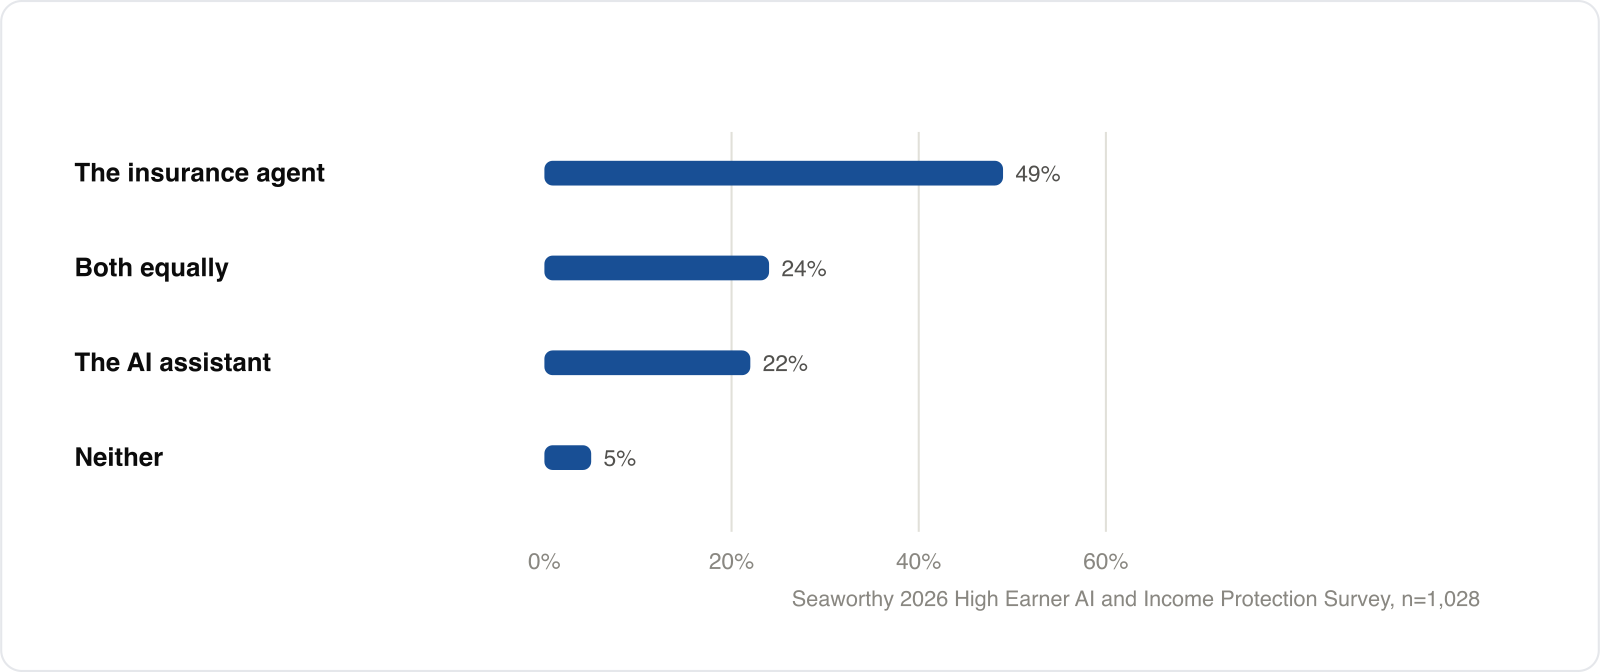
49 percent of the 1,028 respondents in Seaworthy Insurance's September 2026 survey would trust an insurance agent more than an AI assistant for an honest answer to a question about insurance, 22 percent would trust the AI more, 24 percent said both equally, and 5 percent said neither, so the agent wins by a wide margin. The $200,000-plus earners answered almost identically, with 49 percent for the agent, 21 percent for the AI, and 25 percent for both.
Adding the both-equally group to the AI-first group, 45 percent of respondents (21.7 and 23.7 percent before rounding) trust an AI assistant at least as much as an insurance agent, and by the same arithmetic 73 percent trust the agent at least as much as the AI. Among the 794 respondents who said they use AI for financial decisions (everyone who did not answer "I don't use AI for financial decisions" on the year-over-year question), the AI-at-least-as-much figure is 55 percent, and among the 192 respondents working in technology it is 65 percent.
Where do high earners turn first for a major financial decision?
A financial advisor is the first stop for a major financial decision for 41 percent of the 1,028 respondents in Seaworthy Insurance's September 2026 survey. Friends and colleagues came second at 22 percent, Google third at 18 percent, and an AI assistant such as ChatGPT fourth at 16 percent. An insurance agent was the first stop for 3 percent. Search and AI together, at 34 percent, sit above friends and colleagues, though still well behind the advisor.
Among the $200,000-plus earners the advisor's share rises to 46 percent, friends and colleagues fall to 19 percent, Google to 16 percent, and the AI assistant holds at 15 percent. Technology workers are the outlier, with 27 percent naming an AI assistant first, the highest of the six industry groups with more than 100 respondents in the table further down (the 34-person legal group, at 29 percent, is too small to rank).
How many high earners have acted on an AI's financial advice?
35 percent of the 1,028 respondents in Seaworthy Insurance's September 2026 survey had asked an AI assistant a financial or insurance question in the past year and acted on the answer. 62 percent had asked at all, 27 percent asked but did not act, and 38 percent had not asked. Among the $200,000-plus earners, 64 percent had asked and 39 percent had acted.
Self-reported use is up for 39 percent and down for 6 percent. 39 percent of respondents said they use AI for financial decisions more often than a year ago, 32 percent about the same, 6 percent less often, and 23 percent do not use AI for financial decisions at all. Among the $200,000-plus group, 41 percent are using it more.
An AI's brand recommendation lands between an ad and a referral
When an AI assistant recommends a specific company by name, 33 percent of the 1,028 respondents in Seaworthy Insurance's September 2026 survey treat it like an advertisement, 27 percent like a friend's recommendation, 27 percent like an expert's advice, and 12 percent ignore brand names from AI altogether. That puts 55 percent on the friend-or-expert side of the line (27.3 percent each before rounding), and the share rises to 63 percent among the 794 respondents who said they use AI for financial decisions and to 64 percent among technology workers. The $200,000-plus earners were slightly more skeptical than the technology group and slightly less than the full sample, at 57 percent friend or expert.
AI use for financial decisions falls steeply with age
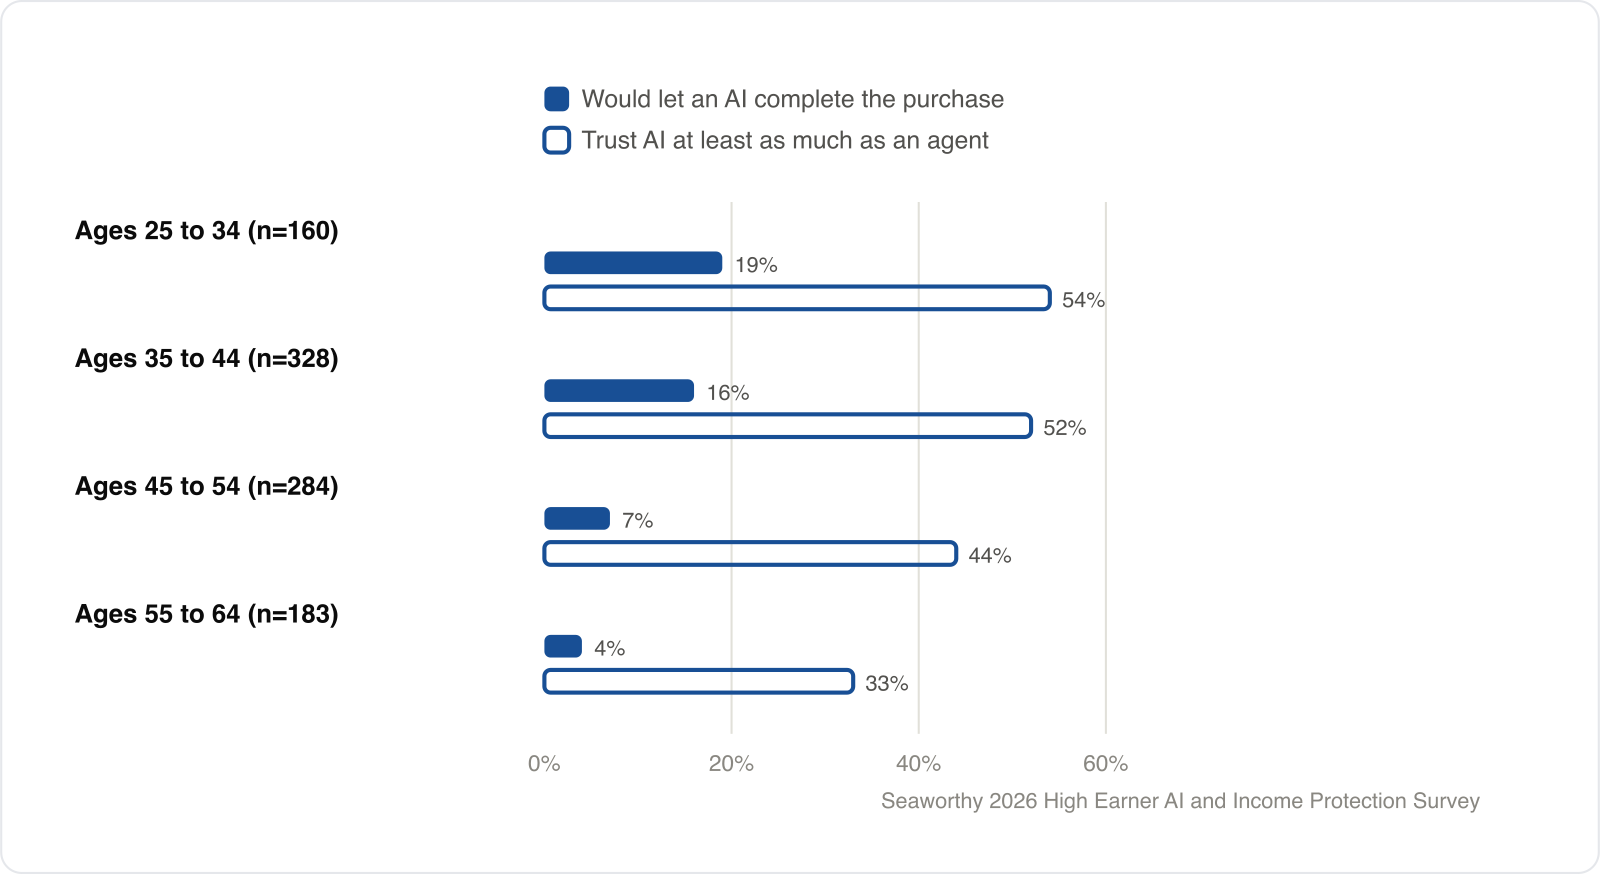
80 percent of respondents aged 25 to 34 (n=160) in Seaworthy Insurance's September 2026 survey had asked an AI a financial or insurance question in the past year and 54 percent would trust an AI at least as much as an agent for an honest insurance answer, against 42 percent and 33 percent among respondents aged 55 to 64 (n=183). The 35-to-44 band (n=328), the largest in the sample, sits close to the youngest group on every measure.
| Age band | Asked an AI in the past year | Trust AI at least as much as an agent | AI assistant is first stop | Would let AI complete the purchase | Using AI more than a year ago |
|---|---|---|---|---|---|
| 25 to 34 (n=160) | 80% | 54% | 19% | 19% | 47% |
| 35 to 44 (n=328) | 71% | 52% | 20% | 16% | 45% |
| 45 to 54 (n=284) | 58% | 44% | 14% | 7% | 36% |
| 55 to 64 (n=183) | 42% | 33% | 8% | 4% | 27% |
Share of respondents in each age band, September 2026, unweighted. The under-25 band (n=28) and the 65-and-over band (n=45) are omitted for sample size. Both are included in every whole-sample figure on this page.
The purchase step is where the age gap is widest in proportional terms. 19 percent of the 25-to-34 group would let an AI complete an insurance purchase, against 4 percent of the 55-to-64 group, a ratio of more than four to one. On research the bands are level, with 71 percent of the 25-to-34 group and 74 percent of the 55-to-64 group willing to delegate it, and on quotes they run from 64 percent down to 56 percent.
Technology workers trust AI most, and healthcare and education workers are the least willing to let it transact
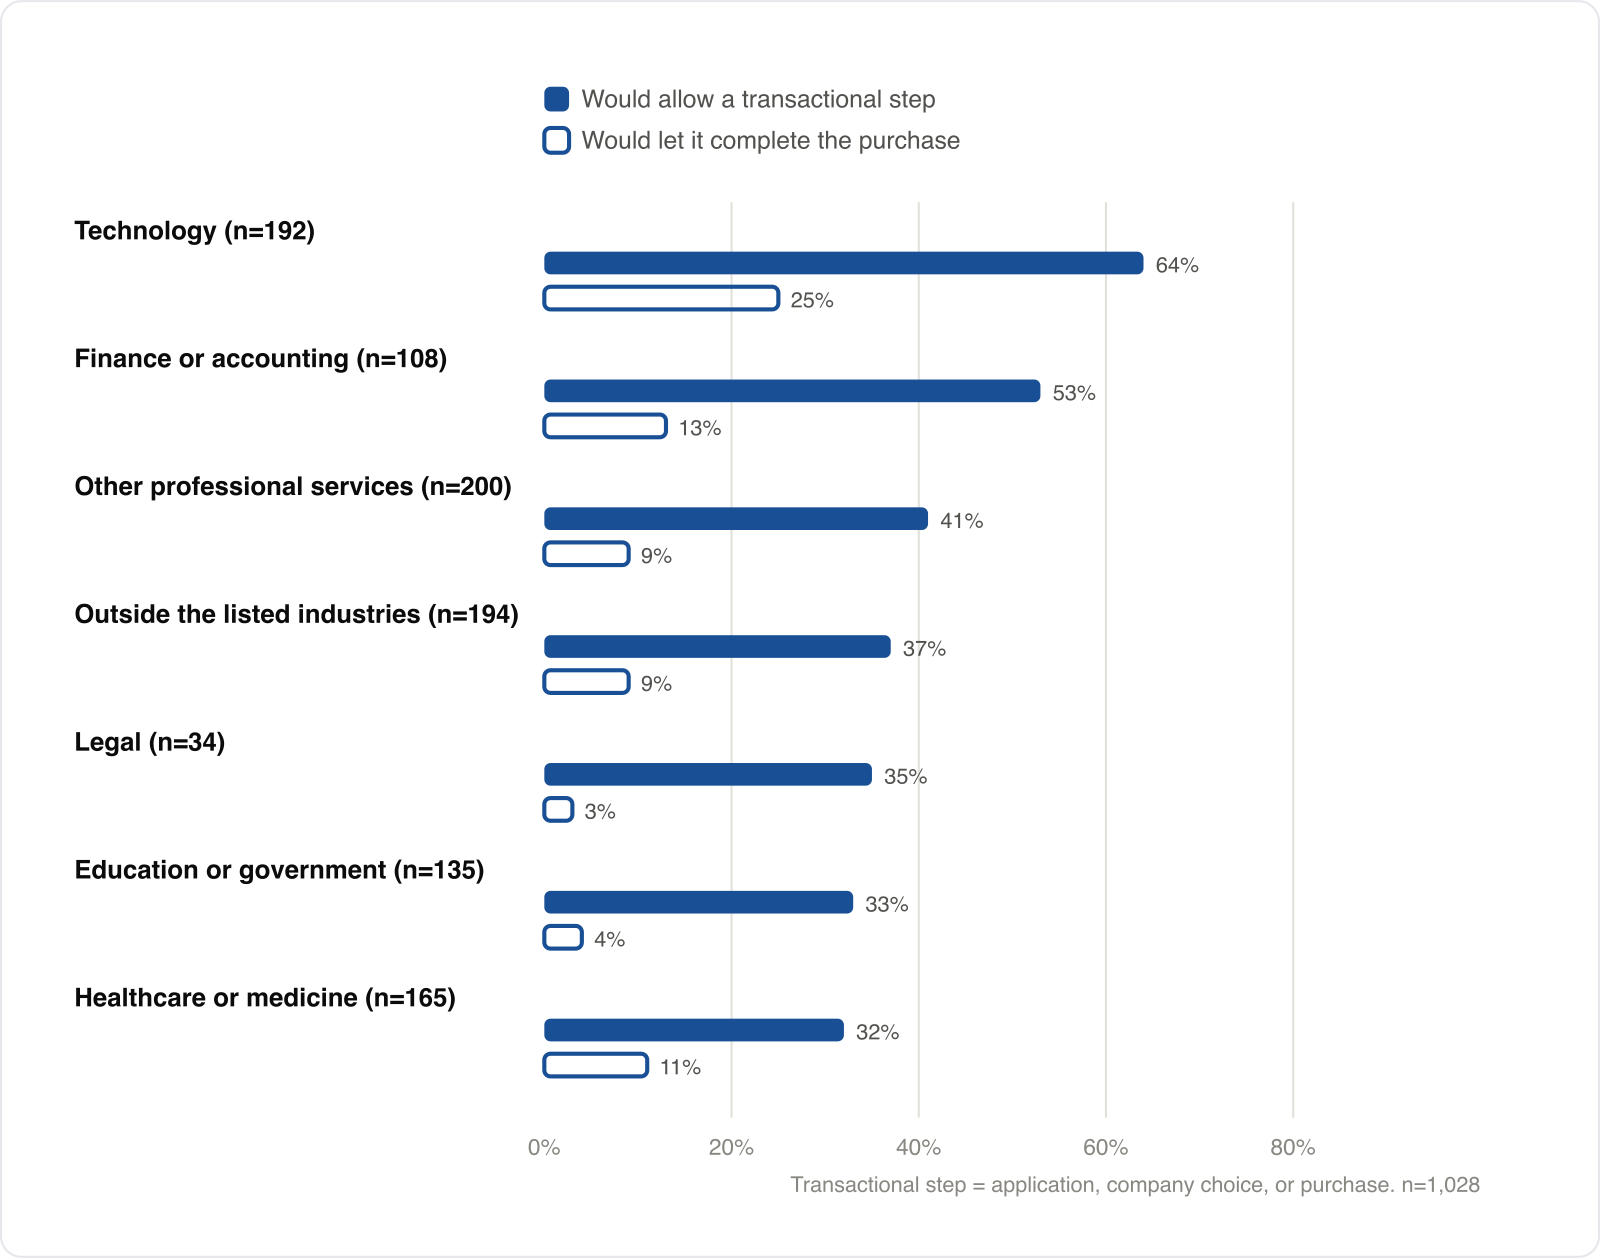
Technology workers lead on every AI measure among the six industry groups with more than 100 respondents in Seaworthy Insurance's September 2026 survey (n=1,028), and healthcare and education workers are the least willing of the industries shown to let an AI touch the transaction, at 32 and 33 percent. Among the 192 respondents in technology, 80 percent had asked an AI a financial question in the past year, 65 percent would trust it at least as much as an agent, 27 percent turn to it first for a major financial decision, and 64 percent would let it take at least one transactional step in an insurance purchase. Among the 165 respondents in healthcare or medicine, those figures were 62, 41, 10, and 32 percent.
| Industry | AI assistant is first stop | Trust AI at least as much as an agent | Asked an AI in the past year | Would allow a transactional step | No disability coverage |
|---|---|---|---|---|---|
| Technology (n=192) | 27% | 65% | 80% | 64% | 24% |
| Finance or accounting (n=108) | 18% | 39% | 69% | 53% | 30% |
| Other business or professional services (n=200) | 13% | 45% | 67% | 41% | 42% |
| Healthcare or medicine (n=165) | 10% | 41% | 62% | 32% | 29% |
| Education or government (n=135) | 11% | 38% | 45% | 33% | 36% |
| Outside the listed industries (n=194) | 12% | 39% | 51% | 37% | 45% |
| Legal (n=34) | 29% | 44% | 53% | 35% | 38% |
Share of respondents in each industry, September 2026, unweighted. A transactional step means filling out the application, choosing the company, or completing the purchase. The legal group is small and its figures should be read as directional. Respondents outside the listed industries wrote in their own, most often construction, manufacturing, or retail. Every respondent appears in exactly one row.
Healthcare workers also sit at the bottom of the first-stop column, with 10 percent naming an AI assistant first against 27 percent of technology workers, and education or government workers are the least likely to have asked an AI a financial question at all, at 45 percent.
What do high earners believe about their income and its protection?
Asked which is their largest financial asset, 39 percent of the 1,028 respondents in Seaworthy Insurance's September 2026 survey named their retirement accounts, 32 percent their home equity, and 28 percent their remaining career earnings. Among the $200,000-plus earners, 45 percent named retirement accounts, 30 percent home equity, and 25 percent career earnings.
As an illustration only, a 35-year-old earning $200,000 a year with 30 working years ahead has $6 million of remaining career earnings before raises, taxes, or inflation.
Asked which would be harder to recover from, 29 percent of respondents chose losing their home to a fire over being unable to work for five years, and 71 percent chose the five years. Among the $200,000-plus earners, 33 percent chose the fire.
How long could a high-earning household last without income?
53 percent of the 1,028 respondents in Seaworthy Insurance's September 2026 survey said their household could keep its current lifestyle for six months or less if income stopped tomorrow. 23 percent said under three months, 30 percent three to six months, 19 percent seven to twelve months, and 29 percent more than a year. The $200,000-plus earners are more cushioned but not clear of it, with 14 percent under three months, 24 percent at three to six, and 38 percent at six months or less in total, while 42 percent could last more than a year.
Runway is the number that sets the elimination period on a disability policy, the stretch between a disabling event and the first benefit check. The premium is priced against that stretch. The policies the agency places most often carry a 90-day elimination period, and in the 2026 book audit 82 percent of placed policies did. A household with under three months of runway, 23 percent of this sample, is choosing between a 90-day period it may not be able to bridge and a shorter one that typically costs more. How to size the benefit and the waiting period against a specific runway is covered in how much disability insurance you need.
How many high earners have disability coverage?
35 percent of the 1,028 respondents in Seaworthy Insurance's September 2026 survey have no disability coverage of any kind, 53 percent have coverage only through an employer, 7 percent have only a policy they bought themselves, 4 percent have both, and 1 percent were not sure. Among the $200,000-plus earners, 31 percent have no coverage, 53 percent employer only, 8 percent their own policy only, 6 percent both, and 2 percent were not sure. Across the industry table, the uncovered share is highest among respondents who named an industry outside the list, at 45 percent, and lowest in technology, at 24 percent.
26 percent with employer coverage believe it replaces bonus and equity income
26 percent of the 546 respondents in Seaworthy Insurance's September 2026 survey who have disability coverage through work and did not say they earn no bonus, commission, RSU, or other equity income believe the employer plan replaces that income, and another 15 percent do not know, 40 percent in all (25.6 and 14.7 percent before rounding). The base is built from the 584 respondents with coverage through work, less the 38 who answered that they earn no such income or have no coverage at work. Among the $200,000-plus earners in that group (n=189), the combined figure is 37 percent. Group long-term disability plans commonly define covered earnings as base salary only and cap the monthly benefit, which is why a bonus-heavy or equity-heavy earner can be covered on paper and still lose a large share of real income at claim time. The gap and the ways to close it are worked through on the RSU and equity compensation page and in the group-versus-individual comparison.
How the survey was run, and its limits
Seaworthy Insurance commissioned the survey and Centiment fielded it to its US consumer panel from September 11 to 17, 2026. Respondents had to be US residents, employed full-time or self-employed, and living in a household with income of $100,000 or more. The survey collected 1,028 completes, with a quota requiring at least 250 from households earning $200,000 or more, which was met. Age and industry fell out naturally and were not quota-controlled, and the results are unweighted. Fifteen questions were asked in total, five on demographics and coverage status and ten on attitudes and behavior, and the wording of each is given in the appendix below. Answer order was rotated on the first-stop, brand-recommendation, and largest-asset questions.
Personal income was asked separately from the household screen. 45 percent of respondents reported personal income of $100,000 to $149,999, 22 percent $150,000 to $199,999, 22 percent $200,000 to $299,999, 6 percent $300,000 to $499,999, and 5 percent $500,000 or more. The 340 respondents at $200,000 or more (33 percent) are the "$200,000-plus earners" throughout this page. 90 percent of the sample is employed full-time and 10 percent self-employed. By industry, 19 percent work in other business or professional services, 19 percent in technology, 16 percent in healthcare or medicine, 13 percent in education or government, 11 percent in finance or accounting, and 3 percent in legal, with 19 percent naming an industry outside the list, most often construction, manufacturing, or retail. By age, 3 percent are 18 to 24, 16 percent 25 to 34, 32 percent 35 to 44, 28 percent 45 to 54, 18 percent 55 to 64, and 4 percent 65 or older.
The median completion time was 103 seconds. 41 responses were completed in under 45 seconds, about three seconds per question, and removing them moves no headline figure by more than two points (the share who acted on an AI's answer falls from 35 to 33 percent, and the share who would let an AI complete a purchase from 12 to 11), so every figure here is reported on the full 1,028. No attention-check question was included, and no responses were removed beyond Centiment's own completion screen. Gender and region were not collected. Because respondents came from an opt-in panel rather than a probability sample, no formal margin of error applies. For scale only, a random sample of 1,028 would carry a sampling error of about plus or minus 3 points at 95 percent confidence, about 5 points for the 340 respondents at $200,000 or more, and about 17 points for the 34 legal respondents, so subgroup differences smaller than those spans should not be read as real. An opt-in panel also likely over-represents people comfortable with digital tools, and self-reported willingness to delegate is not the same as observed behavior. The two AI-use measures on this page differ by design. 794 respondents said they use AI for financial decisions, 642 had asked an AI a financial or insurance question in the past year, and the two groups overlap without nesting (170 of the first group had not asked one, and 18 of the second said they do not use AI for financial decisions), which is why the page names the base on each. Percentages are rounded to whole numbers on this page from the unrounded proportion, not from the one-decimal CSV value, and shown to one decimal in the downloadable CSV, so some rows do not sum to exactly 100, and combined figures are computed from the unrounded data, so they can differ by a point from the sum of the rounded parts. The survey was designed to be repeated, and the same questions are planned to be fielded again in September 2027.
Figures on this page may be cited with attribution to Seaworthy Insurance and a link to this page. Seaworthy is an independent disability insurance brokerage, and the survey was funded and written by the agency without input from any carrier. Version 1.0 was published September 21, 2026. Version 1.1, September 24, 2026, added the employer-coverage section, four FAQ entries, the downloadable topline, and the sampling-error note, and reworded the runway figure from "under six months" to "six months or less" to match the answer option. It also corrected the age ratio on the purchase step from "nearly five to one" to "more than four to one" (19.4 against 4.4 percent) and four cells that had been rounded from one-decimal values instead of the raw counts (19, 31, 41, and 16 percent). No underlying count changed. The author's quotation under the first chart was added the same day. Version 1.2, September 25, 2026, added a media resources section with a press contact and downloadable chart files. Any correction will be logged here with its date.
Suggested citation. Seaworthy Insurance, Seaworthy 2026 High Earner AI and Income Protection Survey, n=1,028, fielded by Centiment September 11 to 17, 2026, https://seaworthy.io/research/high-earner-ai-survey-2026/. The topline and every crosstab on this page, by total, personal income, age band, and industry, are in a downloadable CSV that also carries the derived figures and their bases, including the 794-respondent AI-user base.
Media resources
Press inquiries and interview requests go to Toby Lason, managing partner, at toby@seaworthy.io or (800) 518-1190, and interviews can usually be arranged within a business day. Downloadable assets are the topline and crosstab CSV, the four charts as PNG files (delegation, trust, age, industry), a cover image, and a high-resolution headshot. Two-way cuts of the data that do not appear in the CSV can be run on request.

The questions as asked
- D1. What is your personal annual income, before taxes? ($100,000 to $149,999 / $150,000 to $199,999 / $200,000 to $299,999 / $300,000 to $499,999 / $500,000 or more)
- D2. What is your age? (18 to 24 / 25 to 34 / 35 to 44 / 45 to 54 / 55 to 64 / 65 or older)
- D3. Which best describes your employment? (Employed full-time / Self-employed or business owner)
- D4. Which industry do you work in? (Healthcare or medicine / Technology / Finance or accounting / Legal / Education or government / Other business or professional services / Other, write in)
- D5. Do you currently have disability insurance? (Yes, through my employer / Yes, a policy I bought myself / Both / No / Not sure)
- Q1. When you're making a major financial decision today, where do you turn first? (An AI assistant like ChatGPT / Google / A financial advisor / An insurance agent / Friends and colleagues, order rotated)
- Q2. For an honest answer to a question about insurance, who would you trust more, an AI assistant or an insurance agent? (The AI assistant / The insurance agent / Both equally / Neither)
- Q3. Which of these would you let an AI assistant do on your behalf when buying insurance? Select all that apply. (Research my options / Get and compare real quotes from different companies / Fill out the application / Choose which company to buy from / Complete the purchase / None of these)
- Q4. In the past year, have you asked an AI assistant a financial or insurance question, and did you act on its answer? (Asked and acted on the answer / Asked but didn't act / Haven't asked)
- Q5. When an AI assistant recommends a specific company by name, how do you treat that recommendation? (Like an advertisement / Like a friend's recommendation / Like an expert's advice / I ignore brand names from AI, order rotated)
- Q6. Compared with a year ago, how often are you using AI for financial decisions? (More often / About the same / Less often / I don't use AI for financial decisions)
- Q7. Which would be harder for your household to recover from financially, being unable to work for five years, or losing your home to a fire? (Being unable to work for five years / Losing your home to a fire)
- Q8. Which of these is your largest financial asset? (My home equity / My retirement accounts / My remaining career earnings, order rotated)
- Q9. Do you believe disability coverage through your employer replaces your bonus, commissions, RSUs, or other equity income? (Yes / No / Don't know / I don't have disability coverage through work / I don't earn bonus, commission, or equity income)
- Q10. If your income stopped tomorrow, how long could your household maintain its current lifestyle? (Under 3 months / 3 to 6 months / 7 to 12 months / More than a year)